



Eliminate Waste.
Optimize Every Second.
MudaMap gives engineers and lean practitioners a purpose-built tool to map, analyze, and optimize manufacturing cycle times — all in the browser, no installation needed.
Faster analysis. Fewer errors. Better decisions.
Built for the shop floor. Refined in the office.
See It In Action
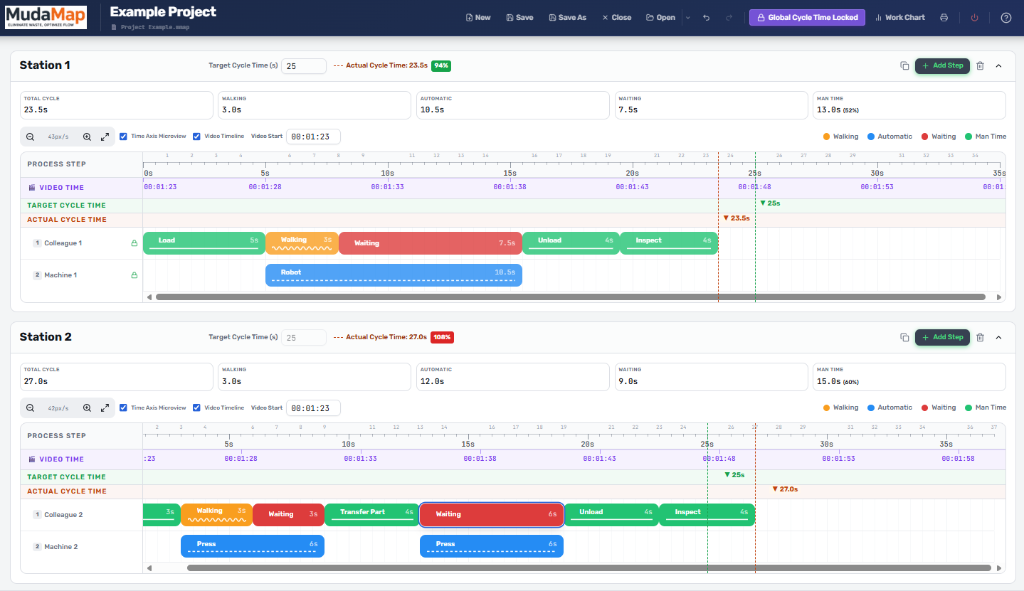
Real cycle time analysis, right in your browser.
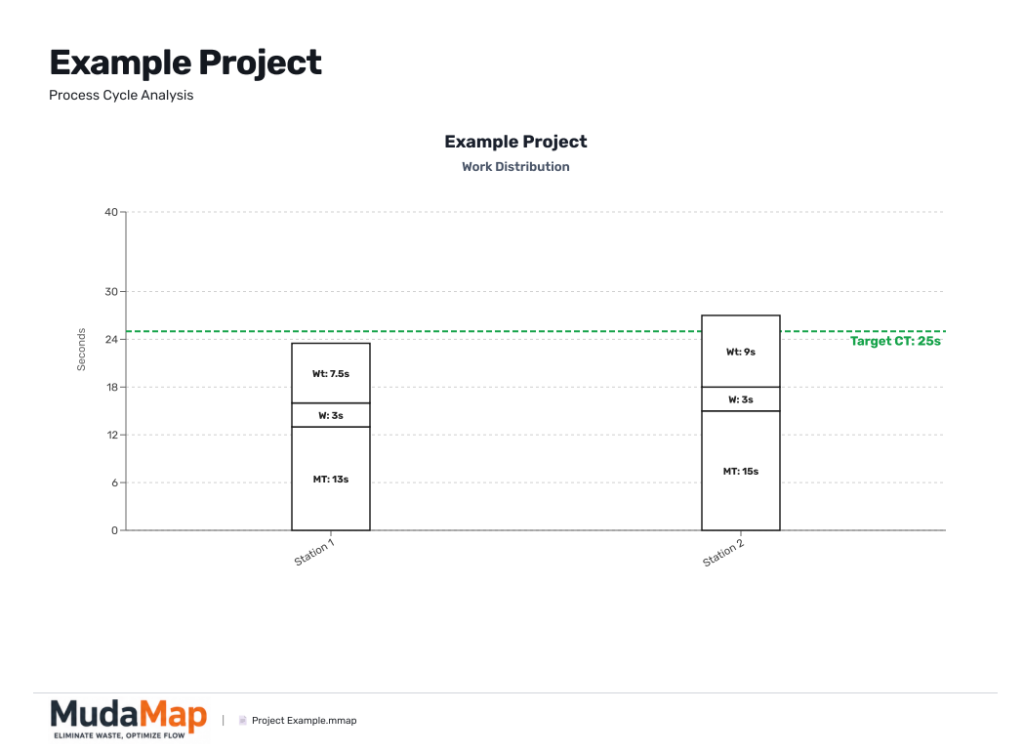
Work Distribution Analysis
Instantly see where time goes — across every station.
The built-in Work Chart breaks down Man Time, Walking, and Waiting per station into a clear stacked bar chart. Compare every station against your Target Cycle Time at a glance and pinpoint bottlenecks before they impact throughput.
- Man Time, Walking & Waiting breakdown
- Target Cycle Time reference line
- Multi-station side-by-side comparison
- Print-ready chart export
Example Project
Process Cycle Analysis
Simple, Transparent Pricing
One plan, full access. Cancel anytime.
Monthly
Full access, billed monthly
Annual
Full access, billed annually
✓ Save $40 vs monthly
Already subscribed? Manage your subscription
No software to install. No IT ticket required.
Works entirely in your browser. Secure, private, and fast.